Support & Resistance - bowling ball
One of the most common ways to identify the market trends is by using trend lines that connect the data points to either give an uptrend or downtrend. The uptrends connect the sequence of higher lows making a ‘support level’ for future price movements. The downtrend connects the sequence of lower highs and making ‘resistance level’ for future price movements. The trend lines, along with support and resistance level, show the direction of the trend.

Course name
Start trading
Investment Support & Resistance
The support and resistant levels represent technical indicators, which are essential tools for technical analysis that are used to determine the price movements of shares or currencies. The support and resistance levels mostly depict the forces of supply and demand in the financial market that do not remain static but constantly move either up or down.
Understanding Support and Resistance
Both the support and resistance refer to price points beyond which the price of the assets cannot rise or fall. The price points are widely studied by technical analysts and traders who use the support and resistance level to determine at which direction to trade and at which price level they should enter or exit their positions. The support point indicates the lowest price the assets tend to trade at, while resistance shows the highest price that an asset tends to trade at.
For example, Alex, as a day trader studies the price charts to determine when to take a long position in Prime Oil PLC; he sees that the price of Premier Oil PLC shares peaked at £60 in the last year which means that £60 is the resistance level of PLC. Alex also notices that the price of a share has not fallen below £30 although it has come close to it, it shows that £30 is the support level of Prime Oil PLC.
Seeing the trend Alex decides to place an order to buy 1000 CFD on shares of Prime Oil PLC, the next time its price falls to £31, he thinks this price indicates a good buying opportunity as at £31, the Prime Oil share price is not going to fall much lower and seems likely to rise as high as £61.
By carefully analyzing the trends and understanding the concept of support and resistance levels, the
short-term traders are more likely to grab the investment opportunity. The short-term traders can
identify the price levels beyond which the asset is unlikely to move and then place their trades
accordingly.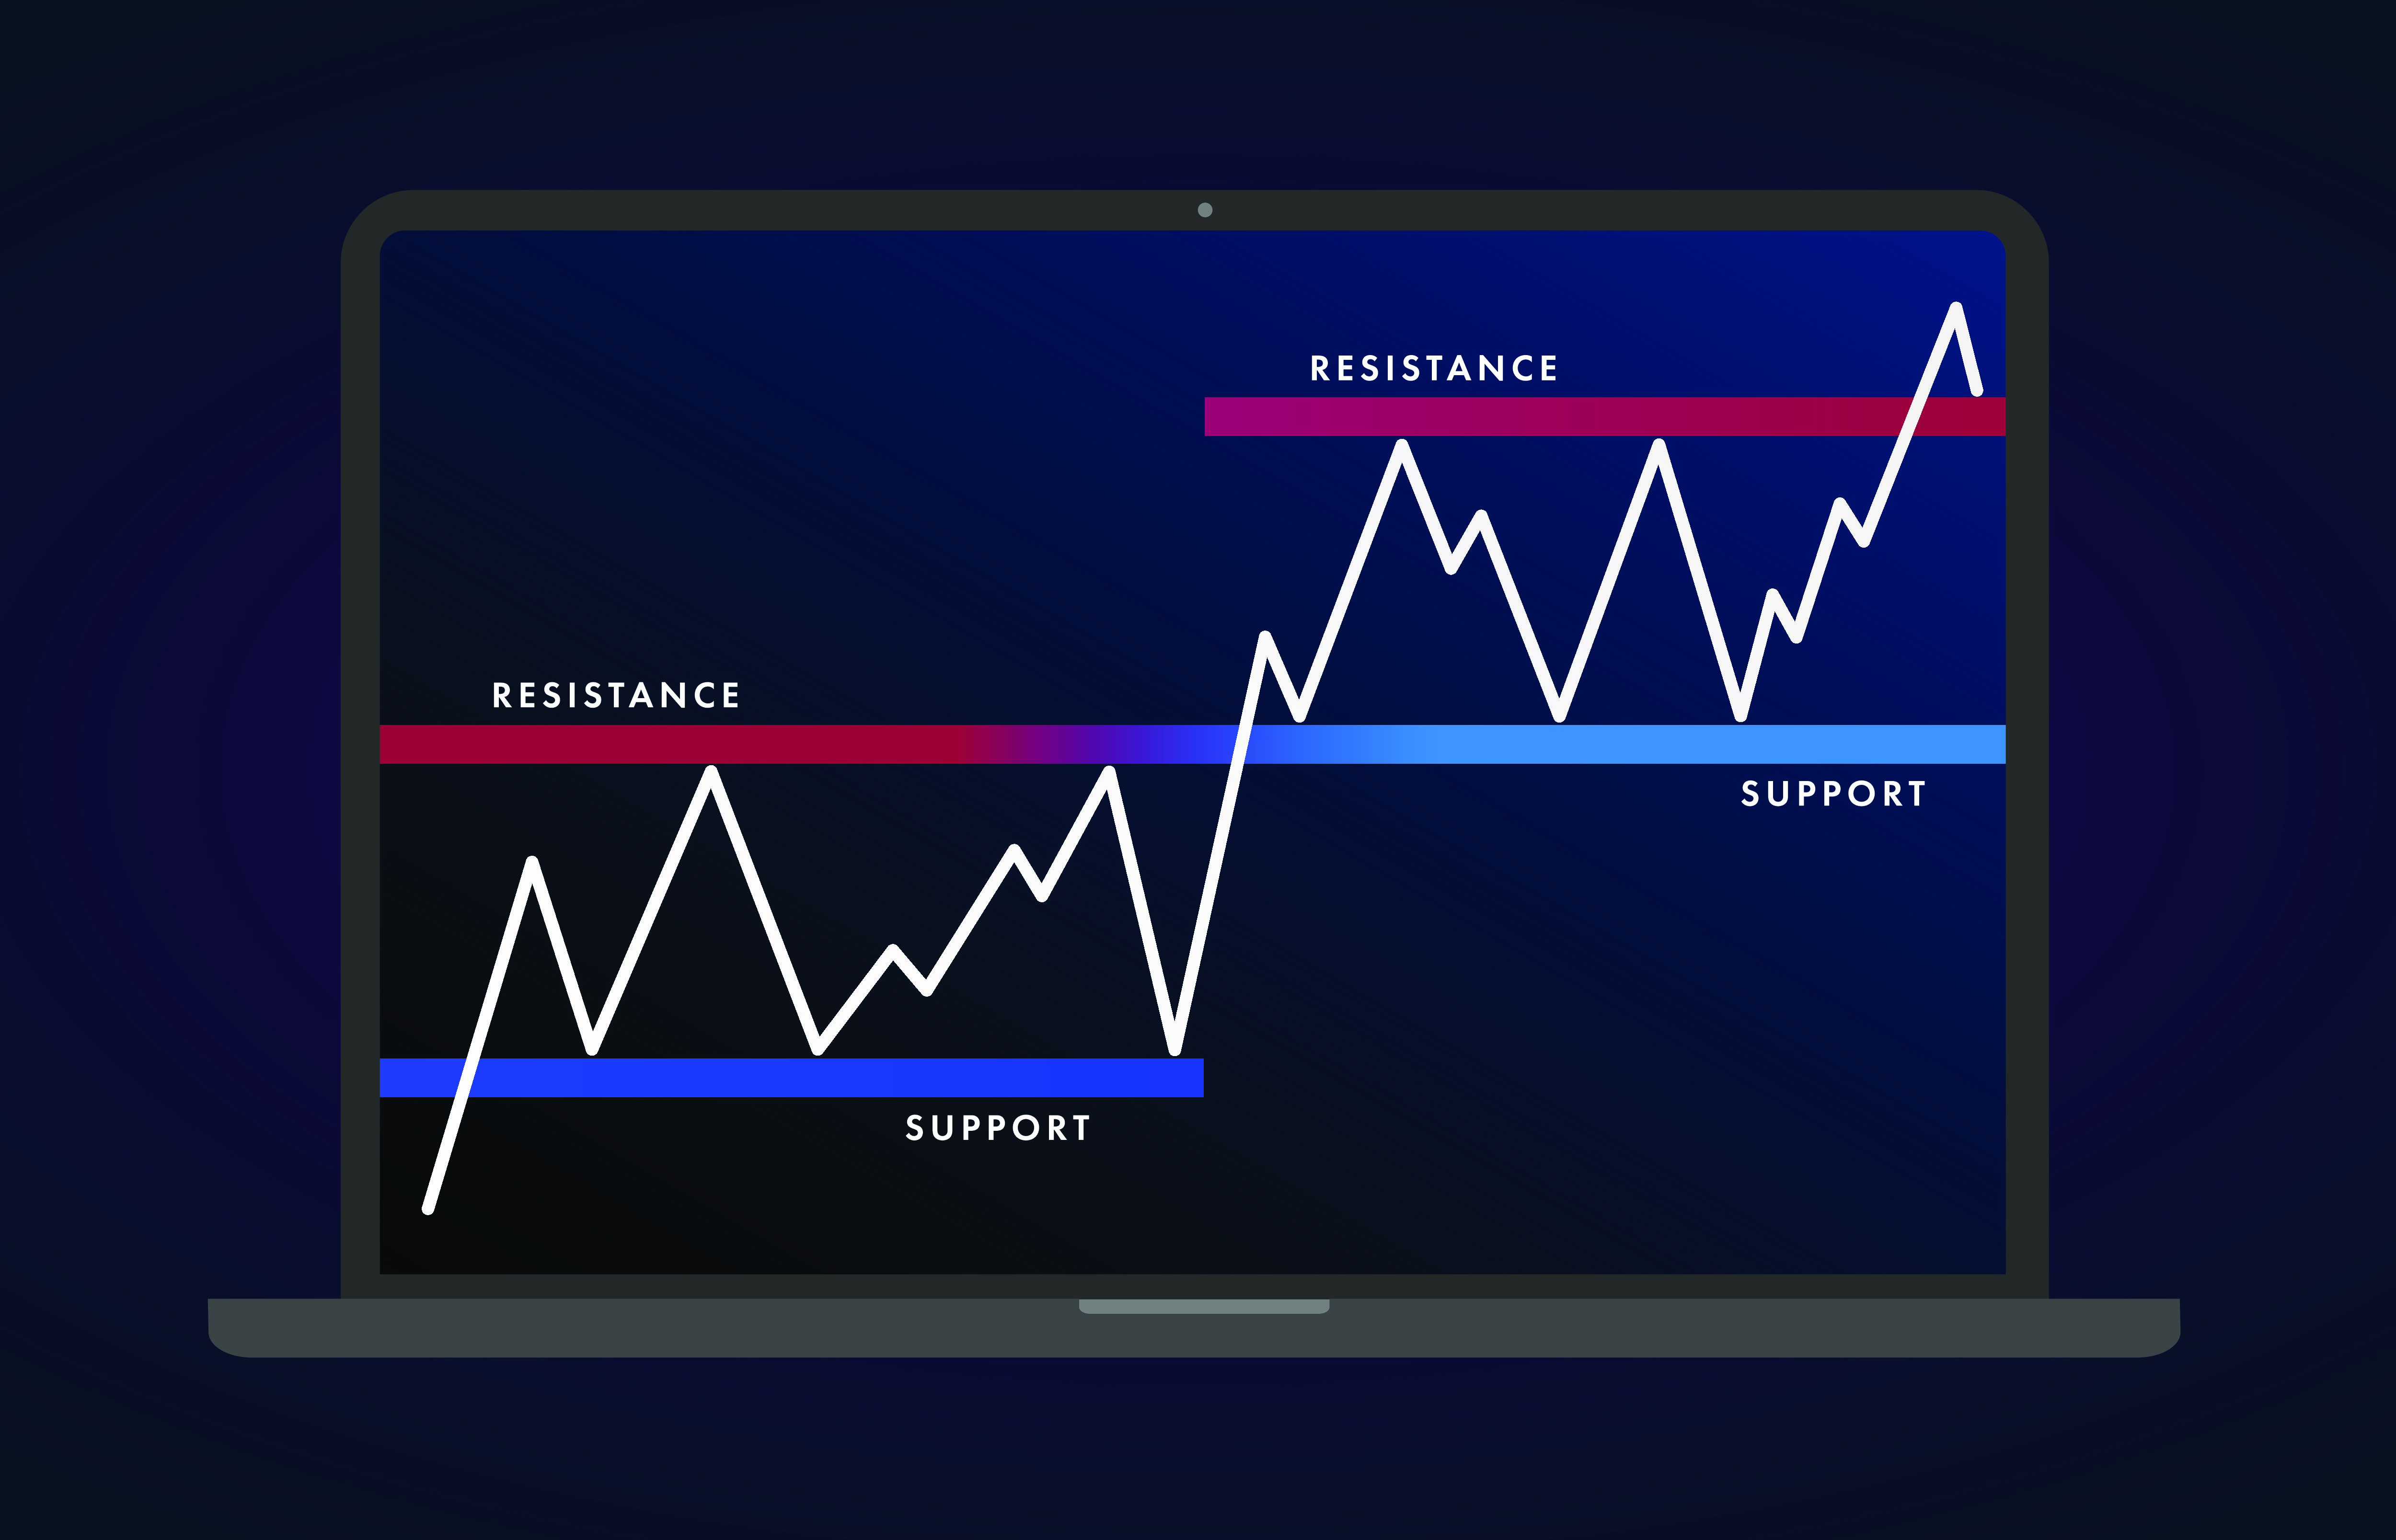
Trading with Support and Resistance
The support and resistance levels show the levels at which the share price of a particular company is expected to stop and reverse. The technique of support and resistance allows traders to properly analyze the price chart and make three conclusions that are
- The direction of the trend
- The time to enter the market
- The time to exit from the market
The support level is where the market price tends to be the lowest, but due to some presence of demand, the price does not fall further than the minimum level. The market price will not break and fall lower but will likely bounce off. But it depends on the type and strength of the stock as the price of the weak stock may break through support level and continue in the downward trend until finding another support level.
The resistance level is the opposite of support, and at this level, due to some presence of supply, the price will not rise further than a maximum level. Just like in support level, the price will not break resistance level but bounce away.
The Bowling Bowl Concept
The support level is called ‘floor,’ and the resistance level is called ‘ceiling.’ For example, an asset can be viewed as a bowling ball that, when bounces, will hit the floor (support) and then bounce back from the ceiling (resistance). The process that involves the ball consistently bouncing or staying between the floor and ceiling is called ‘consolidation,’ and the ball can be compared to a trading instrument such as stock.
Imagine, for instance, that the ball is in mid-air if extra force is applied from above the ball will push through the resistance level. Likewise, if the extra force is applied from below, then the ball will push through the support level. The extra force is required by the Bulls or Bears that can break through the resistance or support level.
Why Traders rely on Support and Resistance Levels
The support and resistance levels are crucial concepts of technical analysis that an investor must know and consider without implementing any investment strategy. A trader may improve the chances of safer investment if he can determine the future level of support. Similarly, forecasting a future resistance level will serve as a price level and indicate whether to keep a long or short position.
There are different methods to identify the support and resistance levels, but the analysis remains the same, which is that the support and resistance indicators stop the price of the underlying asset from moving in a certain direction and allows traders to try to predict the price movement and identify potential buy and sell points.
The technical indicators are pivotal in identifying the trend and future price movements. In support and resistance technique, Fibonacci retracement numbers are used to calculate the entry points while buying and selling stocks, Forex, or commodities. The number system is named after Leonardo Fibonacci, who is an Italian mathematician of the 13th century, and his work is used to develop many technical indicators to analyze financial markets.
The Fibonacci numbers consist of a series of numbers, which are 0, 1, 1, 2, 3, 5, 8, 13, 21, 34, 55, 89, 144 are used to signify the entry points during a market trend. The numbers may seem complex to manipulate, and it usually takes practice and experience to use them efficiently.
Support and Resistance in Forex Market
Support and resistance are broad concept of technical analysis that can be used in the CFD markets.
The resistance level act as a ceiling and prevent any price from breaking through while the support
level acts as a floor and stops price from further falling through. The CFD traders can use the
support and resistance levels to decide when to open or close the trade, the three ways they can do
so are
1. Psychological Levels
Often known as ‘psych levels,’ the psychological level happens when the price ends in a series of zeroes ‘0’s’. It is human nature that many people are intrigued by round numbers. For example, in Forex markets, when traders talk about the future price of GBP, they will give a round figure such as £ 1.5200 or 1.4000 but not 1.5186 or 1.3879.
Traders mostly see clusters of orders around whole numbers that lead to price levels that influence how the price behaves. The most common psych level indicates two or three zeroes at the end, such as 1.7200 or 104.00, but the most powerful psych level has four zeroes at the end, such as 1.8000 or 100.00.
2. Swing Highs and LowsOne of the best ways to identify the support and resistance level on Forex price charts is to mark past levels where the price had a tough time breaking through. As the price flows up and down, at each level that the price has bounced off or reversed, could be a level where the price will probably bounce in the future as well. But this method is quite intensive and requires the trader to draw all the currency pairs that are being traded
3. Pivot PointsThe last mentioned way to identify support and resistance level is by using ‘pivot points’ that are an in-built indicator, available on many platforms that will automatically draw the critical levels without any effort. Pivot points use the past period’s Close, High, and Low prices.
The information above is for education purposes only and cannot be considered as investment advice. Past performance is not reliable indicator of future results.