Learn How to Use the Stochastic Oscillator for Trading Success
In the technical analysis of financial markets, there are various tools and indicators that are used by investors to evaluate the historical price movements and may predict the future price of the asset. A Stochastic oscillator is one such indicator that is used in trading of Stock, Forex, and Indices. The word ‘Stochastic’ comes from the Greek language and means ‘random.’

Course name
Start trading
Stochastic Oscillator
The Stochastic oscillator shows an asset’s closing price in comparison to its price range for a certain time frame. The process is used to help traders to ‘Buy’ or ‘Sell’ the asset. The readings oscillate from 0 to 100 and signify the momentum of the trend. The stochastic oscillator works on a general theory that says when the market is trending upwards; then prices will close near the high, likewise when the market is trending downwards, then the prices will close near the low.
A stochastic indicator is a type of momentum indicator that is widely used to measure overbought and
oversold asset. The stochastic indicator result varies close to the mean price level as it relies on
the past asset’s price. The sensitivity of the oscillator to measure movements can be reduced by
adjusting the time period or by taking a moving average of the result.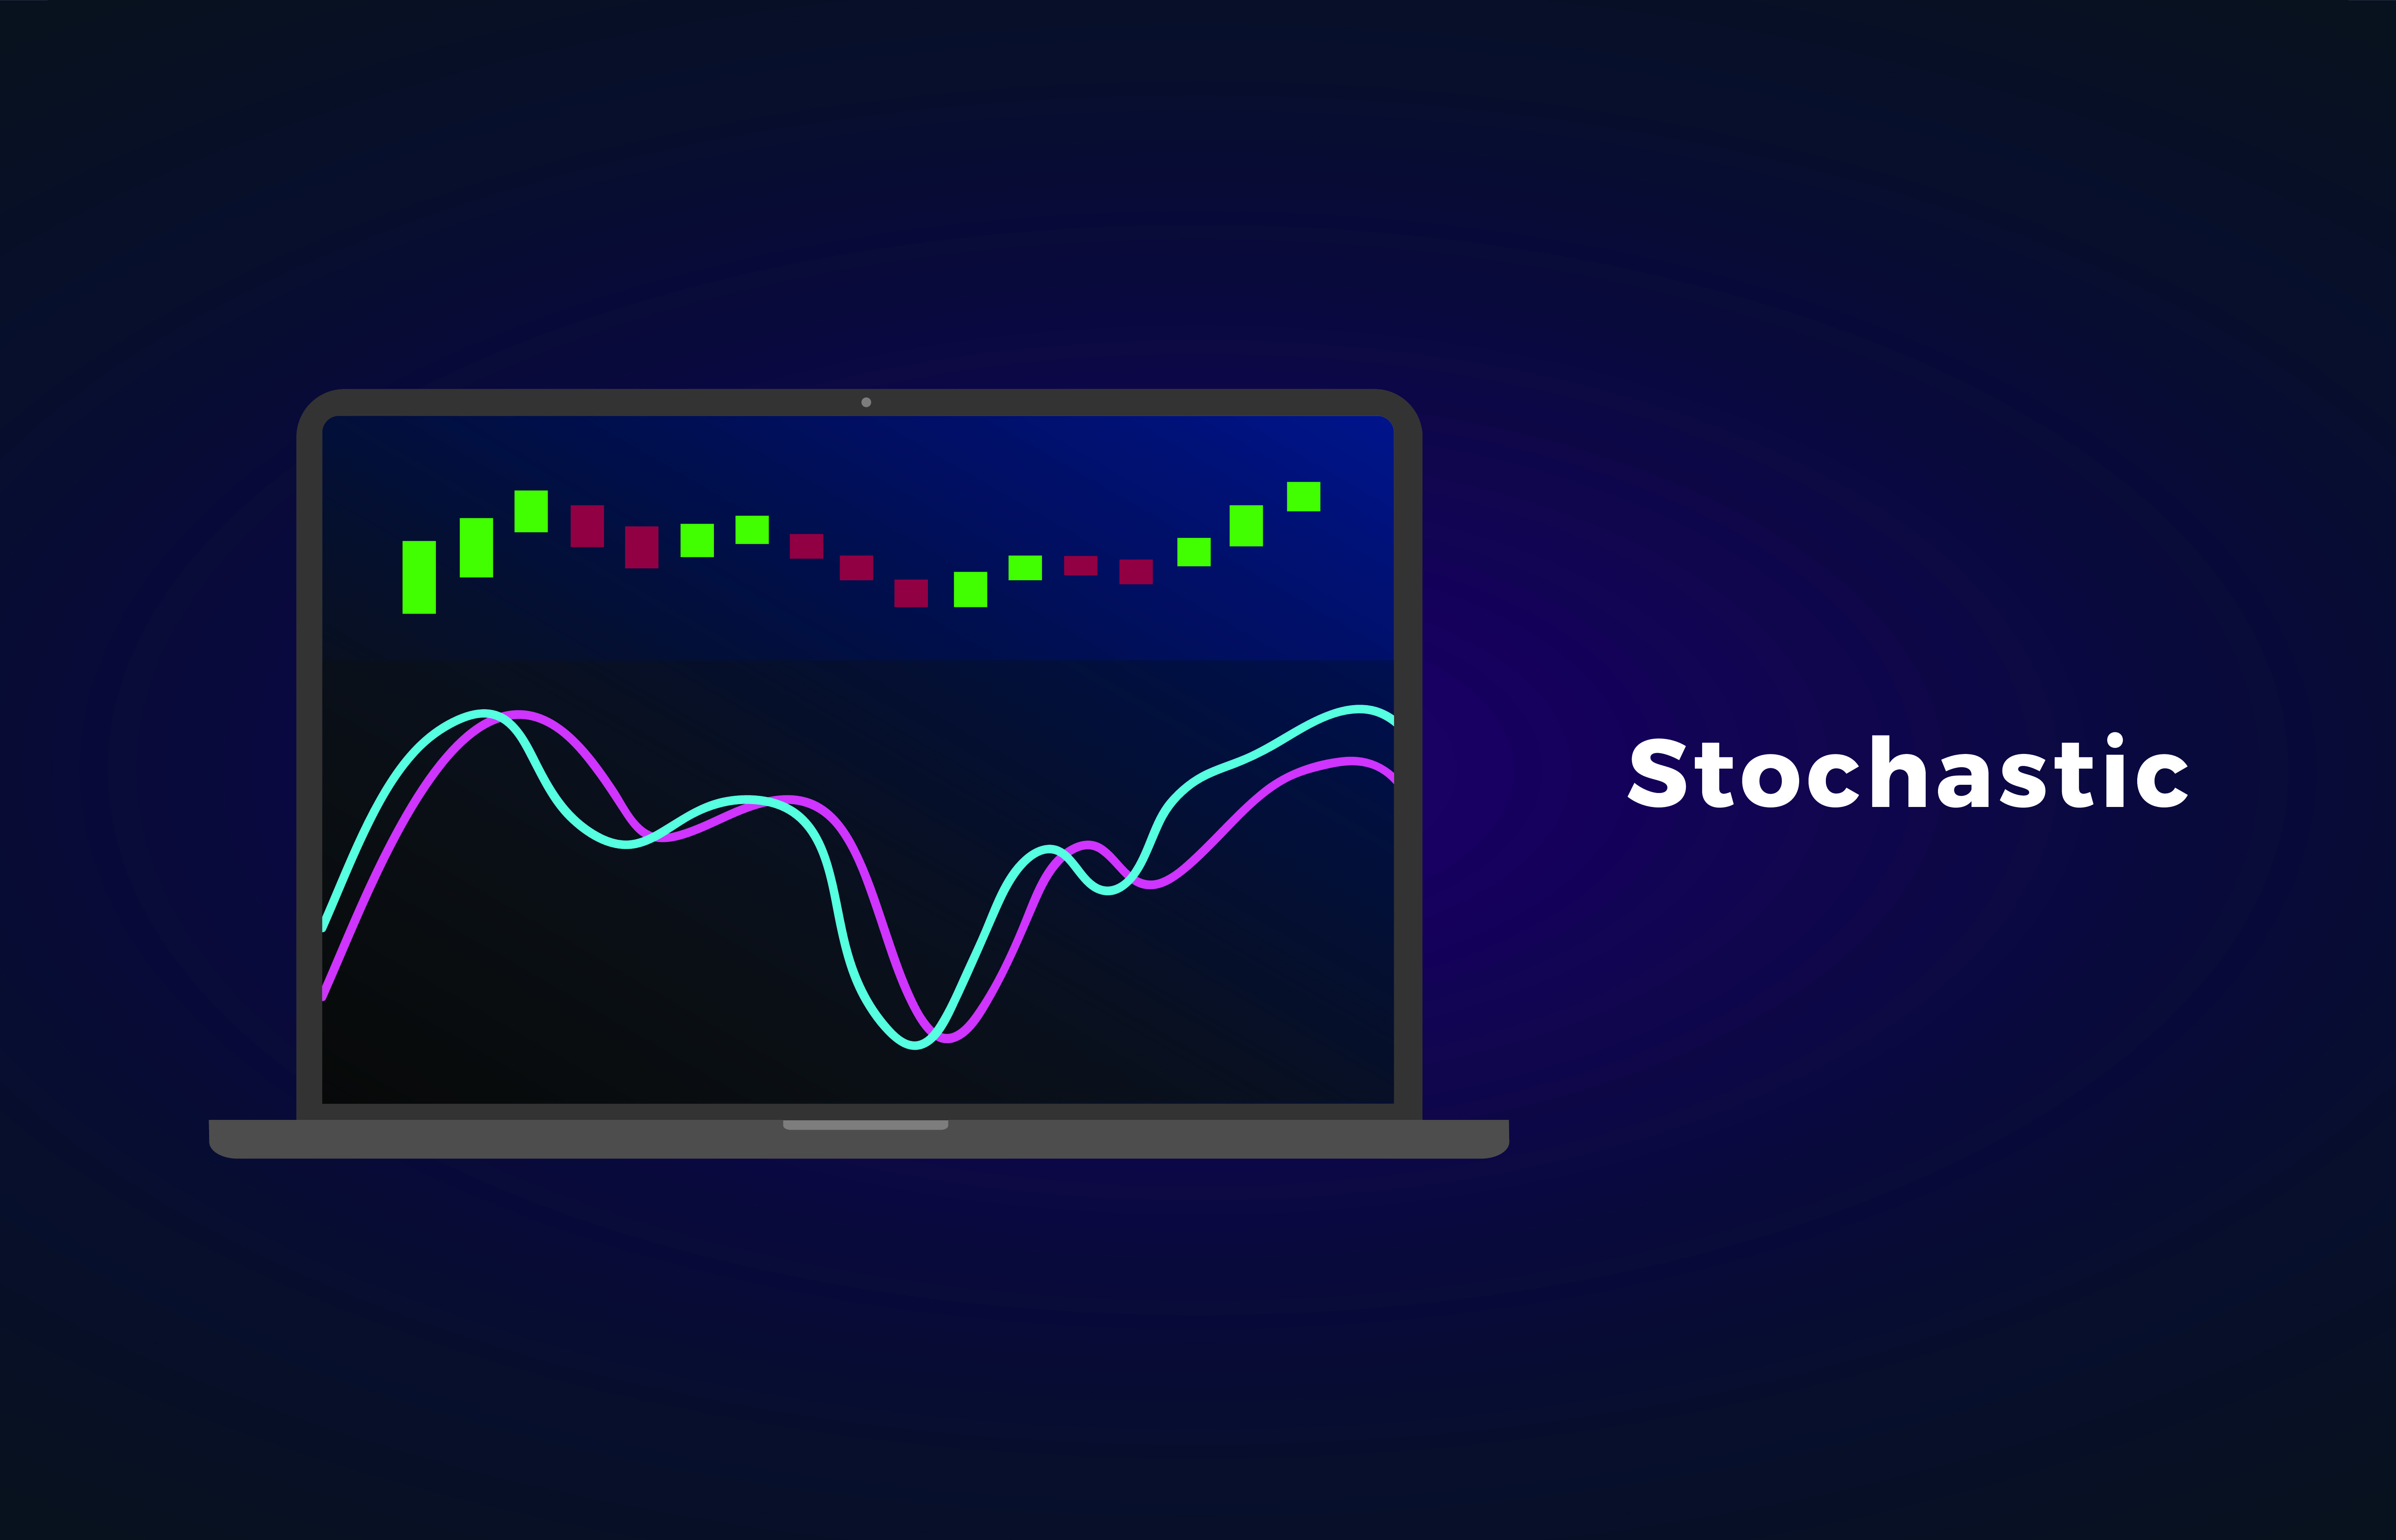
History of Stochastic Oscillator
The stochastic oscillator was established by George Lane in 1950s to locate the closing price of a stock in comparison to the high and low range of the stock for a particular time frame, which is a standard of 14-day trading period. George Lane emphasized that the stochastic oscillator does not follow the price or volume but rather follows the momentum of price. He also said that the momentum of the price for certain stock changes before the price of stock changes itself, this way, the stochastic oscillator could be used to predict the reversal when bullish or bearish divergences are shown by the indicator.
How to Calculate Stochastic Oscillator
The Stochastic oscillator is calculated by determining two factors, the first is %K and the second is %D.
The formula for calculating %K is
% K = 100 × (C- L of N/H of N – L of N)
Where;
% K: Current value of the stochastic indicator
C: The most recent or last closing price
L of N: The lowest price of the ‘N’ previous trading sessions
H of N: The highest price of the ‘N’ previous trading sessions
The default number for ‘N’ previous trading sessions is 14, which could describe as 14 hours, days, or weeks. By putting the value of ‘N,’ the formula now becomes
% K = 100 × (C- L14/H14– L14)
The % K is sometimes called the slow stochastic indicator, and % D is called the fast stochastic indicator. The factor % D equals to a three-period moving average of % K.
What is the Purpose of using a Stochastic Oscillator?
Both the factors, %K and %D are plotted on the graph side by side, and the traders look fluctuations from 0 to 100. The transaction signals are generated when the %K crosses %D. If the stochastic value is above 80, then the asset is said to be overbought; similarly, if the stochastic value is below 20, then the asset is said to be oversold.
The charts used to evaluate the stochastic oscillation usually illustrated by two lines, where one line reveals the value of stochastic oscillation for each or daily session while the second line shows the 3-day moving average. As the price in the market is constantly moving, an intersection of the two lines indicates a change in momentum and an upcoming reversal in the trends.
The difference between the trading price action and the corresponding stochastic oscillator is called a ‘divergence’ and indicates a reverse in the market trends. For instance, when the price hits a lower low and the oscillator shows a higher low, it is called a Bullish divergence, in contrast, if the price is making higher high but oscillator showing lower high, then it is a bearish divergence.
How to Use Stochastic Oscillator
The stochastic oscillator is a common technical analysis tool that is widely used by investors. The stochastic oscillator is determined by deducting the low of the period from the current closing price, then dividing it with the total range and then multiplying it with 100. The typical time period is taken to be 14 days. The formula is
% K = (C- L14/H14– L14) × 100
For example, let suppose
C = 155
L (14-day Low) = 135
H (14-day High) = 160
% K = (155- 135/160– 135) × 100
% K = 0.8 or 80
The stochastic oscillator reading for the current session is 80, which indicates that the asset is close to being overbought.
Difference between Stochastic Oscillator and Relative Strength Index
In technical analysis, both the Stochastic Oscillator and Relative Strength (RSI) Index are called momentum indicators and often used side by side but both are based on different theories. The Stochastic Oscillator is calculated on the theory that the closing prices should close in the same direction, such as the current trend.
While the RSI, on the other hand, follows the oversold and overbought levels by calculating the rate of price movements. The Stochastic Oscillator is used to show the consistent price trends while the RSI is used to measure the speed of price movements. The information above is for education purposes only and cannot be considered as investment advice. Past performance is not reliable indicator of future results.