Harami Patterns
The use of price charts in the Forex market allows traders to analyze the performance of the market and may predict future price movements of the currency. The price charts are an essential component of technical analysis that help the traders to review past market prices and use technical indicators to formulate an investing strategy and know when to enter and exit the market. The two main reasons that investors take help from the technical analysis is

Course name
Start trading
Harami Patterns
- Identifying the market trend
- Identifying the support and resistance level through price charts and time frames
The price chart is a graphical representation of past price movement of currency pairs across varying time frames. The Y-axis (vertical axis) of the graph represents the exchange rate, while the X-axis (horizontal axis) signifies the time. The price movement is measured from left to right, and the most recent price is present on the furthest right. The price action on the graph is identified in two aspects
- Trend; when prices rise (Uptrend, Bullish trend) when price fall (Downtrend, Bearish trend),
- Range; when prices move sideways (when the supply and demand forces are equal)
The technical analysis reveals that the short-term price movements are the result of the difference
between the supply and demand for a particular asset that is being traded. The Forex chart is one of
the best tools to evaluate both the price and volume of the trade. The three charts that are most
commonly used by traders are line, bar, and candlesticks. The candlestick charts are the most
popular and commonly used by traders as it shows all the necessary information from the opening and
closing price, and the high and low price.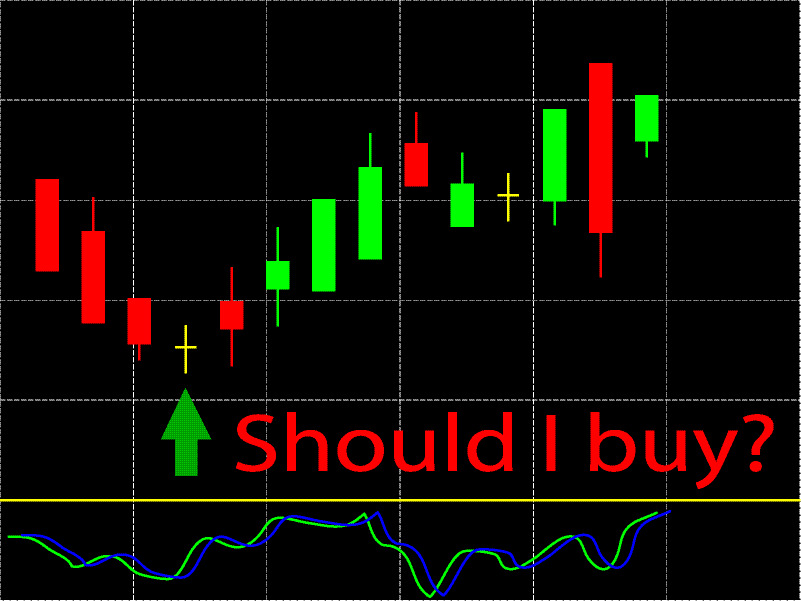
Harami Patterns
The Harami candlestick pattern is one of the most widely used patterns in Forex trading that is used to identify the extension or reversals of trends. The Harami pattern is different and unusual as it consists of two candlesticks, the first one is large, and the second one is small, and its body is contained within the first one’s body and is called a ‘Doji.’
Harami is a Japanese word which means ‘conception’ or ‘pregnant,’ and it is symbolic as the first candlestick is seen as a mother with a large body and a small candlestick that encloses in the first candlestick. The Harami pattern occurs after two or more days of trading, and it has two states Bullish Harami and Bearish Harami. The advantages of Harami pattern are
- Can be identified easier in comparison with other methods
- Opportunity to use large movements
- Widely acknowledged as it allows the traders to identify and grab the reversal at the correct time with tight risk.
Bullish Harami:
The bullish Harami is a bullish reversal pattern in the bear price movement that appears at the bottom of the downtrend. The large candle in the pattern denotes a bearish trend, and the small enclosed candle indicates a bullish trend. The bullish Harami is a type of candlestick indicator that shows there is a changing momentum, and the bearish trend is about to end. The pattern can easily be identified as a big black candle is followed by a small white candle.
The bullish Harami occurs when the Doji (smaller body) will close higher within the larger candle of the previous day, alerting that a reversal is likely to occur. Traders look at bullish Harami as an opportunity to enter the trade with a long position on the asset. The bullish Harami depends on a downtrend shown by the initial candles, which means that the bearish trend will push the price lower. The reversal signals are usually stronger at support and resistance levels as well on highs and lows.
Bearish Harami:
The bearish Harami is a reversal in bull price movement. It is a two-bar candlestick reversal pattern that signifies the bullish trend is about to end, and prices will reverse to lower values. The bearish Harami pattern is identified on the chart when a big white candle is followed by a small black candle. For the uptrend formation, the opening and closing prices of the second candle must be enclosed in the body of the first candle.
The traders can use other technical indicators such as Stochastic oscillator and relative strength index (RSI) along with bearish Harami pattern to increase the effectiveness of the trade. The size of the second or smaller candle is critical, and it will determine the pattern, the smaller the second candle, the more chance a reversal will occur.
Conclusion:
Technical analysts and traders who are looking to evaluate the market trends for short-term traders will most probalby rely on candlestick patterns to study the key indicators and then make decisions. Both the bullish and bearish Harami patterns are used to forecast the upcoming reversals and can be used to predict future trends.
The Harami trend signifies a reverse pattern and must always be identified in an existing trend. The color of the second candlestick is mostly the opposite of the first candlestick. The important feature is the presence of the Harami pattern and direction of the trend; if the Harami pattern is located close to the trend line, support or resistance line, then it becomes more significant.
The presence of the small body of the second candlestick means that there are indecision and uncertainty, which will result in the sudden movement of the trend. When the Harami pattern appears in a downtrend then it is a Bullish signal, and when the Harami pattern appears in an uptrend, then it is a bearish signal.
The information above is for education purposes only and cannot be considered as investment advice. Past performance is not reliable indicator of future results.